Field Guide Metrics
Trading volume and OBV: what volume counts and what it misses
Volume spikes and Granville's on-balance volume, why crypto volume is hard to compare, and what bitcoin and ether history shows.
1. How to read it / Where it misleads
Crypto trading volume, the one chart input not built from price, comes from a shifting set of venues. Volume counts how much changed hands, and in common usage it is read as a sign of how many participants stood behind a move. Two ways of using it are common: watching for days when volume jumps far above normal, and on-balance volume, or OBV, a running tally that adds a day's volume when the price closes up and subtracts it when the price closes down. This entry explains what each measures, how they are used, and what bitcoin and ether history shows.
This explains how indicators are calculated and described. It is not a signal, forecast or recommendation, and past behaviour does not predict prices.
2. Where it comes from
Joe Granville introduced OBV in his 1963 book Granville's New Key to Stock Market Profits; TradingView describes it as "one of the first known indicators to account for positive and negative volume flow" (source 1). Volume spikes have no single originator.
3. What it measures
A volume spike, as Le Coin's Digital Assets Expert defined it, is a day whose volume is at least twice the median of the prior 30 days, split by whether the day closed above or below its open (source 3).
OBV starts at zero and keeps a cumulative sum. Its level depends only on the start date and means nothing alone; only its direction carries information. A common practice is to compare it with a moving average of itself to see whether that direction has turned.
4. How it is used
TradingView writes that OBV is mainly used to confirm or identify trends, or to anticipate price moves after divergences, where OBV and price head in different directions (source 1). In that usage, volume stands for conviction: a rise on heavy volume is described as broadly backed, one on thin volume as fragile. Bollinger's rules list volume as a family of indicators that can complement a momentum reading, because it draws on different information (source 2).
5. A caveat on crypto volume
Crypto volume is not a single exchange's tape. CoinMarketCap's figure is aggregated across the venues it tracks, that set of venues changes over time, and reported volume on some venues can include wash trading, where the same party trades with itself (source 3). Volume levels across years are therefore not like for like.
Bitcoin's events here start in 2014 for a data reason: CoinMarketCap reports zero volume on 248 days between June 2011 and December 2013, which would break both the spike rule and OBV. Ether's events start in 2016.
Fig. 1. Bitcoin volume spikes and on-balance volume over the last two years.
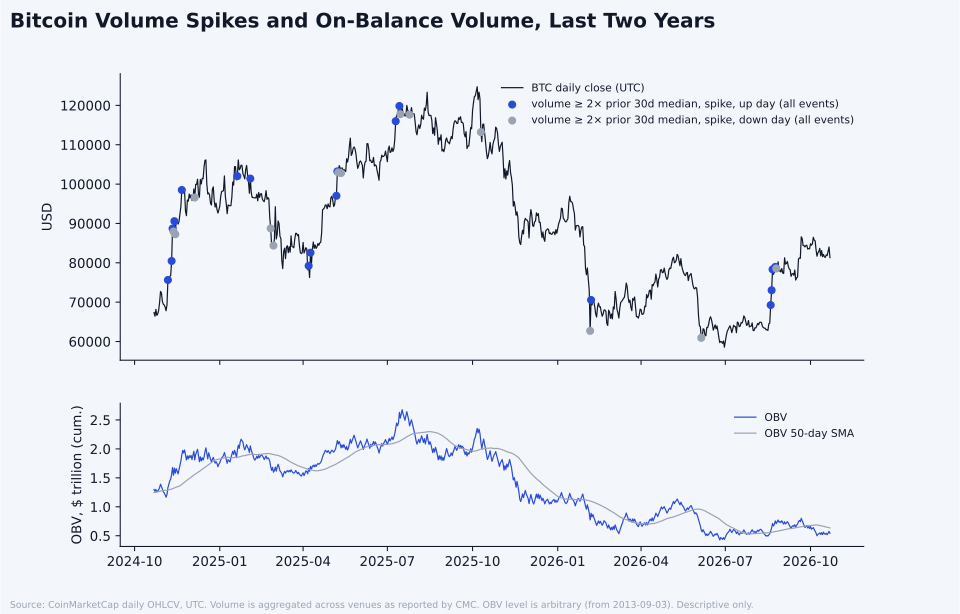
Fig. 1. Bitcoin volume spikes and on-balance volume, last two years. Prices and market data: CoinMarketCap, https://coinmarketcap.com, accessed Oct. 22, 2026, 12:24 a.m. ET. Le Coin calculation.
6. What the history shows
After a 30-day whipsaw rule, which ignores any event that repeats the same type within 30 days, bitcoin had 42 spikes on up days and 36 on down days; ether had 35 and 38. Thirty days after a bitcoin up-day spike, the price was higher in 28 of 42 cases; after a down-day spike, in 21 of 36. For ether the figures were 19 of 35 and 21 of 38.
OBV direction showed little difference. Ninety days after OBV crossed above its 50-day average, bitcoin was higher in 26 of 49 cases with a full window (50 crosses); after it crossed below, in 28 of 52 (53 crosses). Ether's figures were 23 of 47 and 26 of 47. The two directions produced similar mixes of outcomes, and the crosses happen every few weeks, so each one carries little information.
Fig. 2. Past forward returns after volume spikes on up and down days, bitcoin and ether.
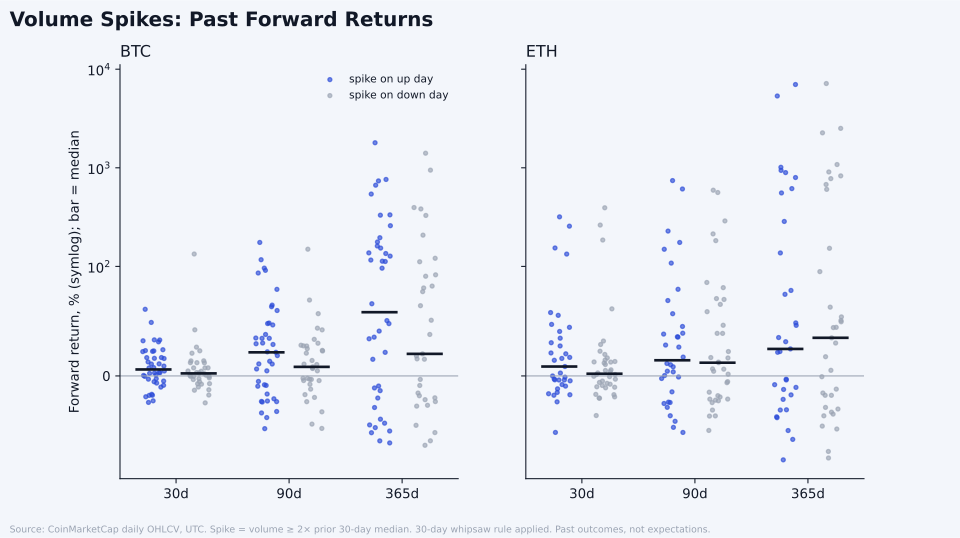
Fig. 2. Volume spikes: past forward returns. Prices and market data: CoinMarketCap, https://coinmarketcap.com, accessed Oct. 22, 2026, 12:24 a.m. ET. Le Coin calculation.
7. The objection
The groups hold 33 to 53 cases each, so one case moves the share of positive outcomes by 2 to 3 points. Nearly all one-year windows overlap, so the cases are not independent and the long-run rise in both coins lifts one-year figures. Without the whipsaw rule, spikes cluster heavily: 129 of 171 bitcoin up-day spikes share 30-day windows with another.
8. The tell
In Le Coin's view, crypto volume is best read as a rough gauge of activity across the venues a data provider happens to track. OBV's record here shows its direction changed little about what followed.
Sources
- 1TradingView support, "On Balance Volume (OBV)," https://www.tradingview.com/support/solutions/43000502593-on-balance-volume-obv/, accessed Oct. 23, 2026, 4:21 p.m. ET.
- 2John Bollinger, "Bollinger Band Rules," BollingerBands.com, https://www.bollingerbands.com/bollinger-band-rules, accessed Oct. 23, 2026, 4:15 p.m. ET.
- 3Prices and market data: CoinMarketCap, https://coinmarketcap.com, accessed Oct. 22, 2026, 12:24 a.m. ET; Le Coin Digital Assets Expert calculation from CoinMarketCap Pro API daily OHLCV (v2 ohlcv/historical) for BTC (July 14, 2010 to Oct. 22, 2026) and ETH (Aug. 8, 2015 to Oct. 22, 2026), files last refreshed Oct. 23, 2026, 6:16 a.m. ET. UTC-day USD volume aggregated across tracked venues; BTC events from Jan. 1, 2014 and ETH from Jan. 1, 2016; spike = volume at least twice the prior 30-day median; OBV crosses of its 50-day average; forward changes over 30, 90 and 365 calendar days; 30-day whipsaw rule; full tables in the research pack.Holding the Corner.
Not financial advice.