Field Guide Metrics
Swing highs, lows and Fibonacci: how chart readers map past moves
Swing highs and lows, Fibonacci retracements and pullbacks to an average, shown on two past bitcoin swings as illustrations only.
1. How to read it / Where it misleads
Some of the most common lines drawn on a bitcoin chart rest on turning points picked after the fact and on ratios with no established link to price. In common usage, chart readers mark the swing highs and lows, the peaks and troughs where a move turned, and describe the sequence as the market's structure. Fibonacci retracement levels, fixed fractions of a past move, are often laid on top, and price is compared with a moving average such as the 50-day exponential average or the Ichimoku Kijun-sen. This entry explains what each of these measures and how each is described. It uses two past bitcoin swings as illustrations, not as a test.
This explains how chart tools are drawn and described. It is not a signal, forecast or recommendation, and past behaviour does not predict prices.
2. Structure
Structure is a description of swing points. A run of higher swing highs and higher swing lows is commonly described as an uptrend; lower highs and lower lows as a downtrend. Defining a swing needs a rule. Le Coin's Digital Assets Expert used one: a day is a swing high if its high is the highest of the 61 days centred on it, 30 either side, and a swing low likewise. That rule can only confirm a pivot, or turning point, 30 days after it happens, and it found 59 swing highs and 58 swing lows from 2010 to 2026 (source 4).
As an illustration of the vocabulary only, bitcoin's swing highs of $109,115 in January 2025, $111,970 in May, $124,457 in August and $126,198 in October 2025 were each higher than the last, a run that in common usage would be called an uptrend structure. The swing highs after it have been $97,861 in January 2026, $82,792 in May and $87,364 in September (source 4).
3. Fibonacci retracements
A Fibonacci retracement divides a past move into fractions, usually 23.6%, 38.2%, 50%, 61.8% and 78.6%, drawn between a peak and a trough. TradingView describes the tool as a way to define support and resistance and says it rests on "the theory that markets will retrace a specific portion of a move" before resuming (source 1). The ratios come from the Fibonacci number sequence; no established causal link ties them to prices.
Fig. 1. Illustrative: Fibonacci retracement levels drawn on bitcoin's decline from its November 2021 high ($68,789.63) to its November 2022 low ($15,599.05).
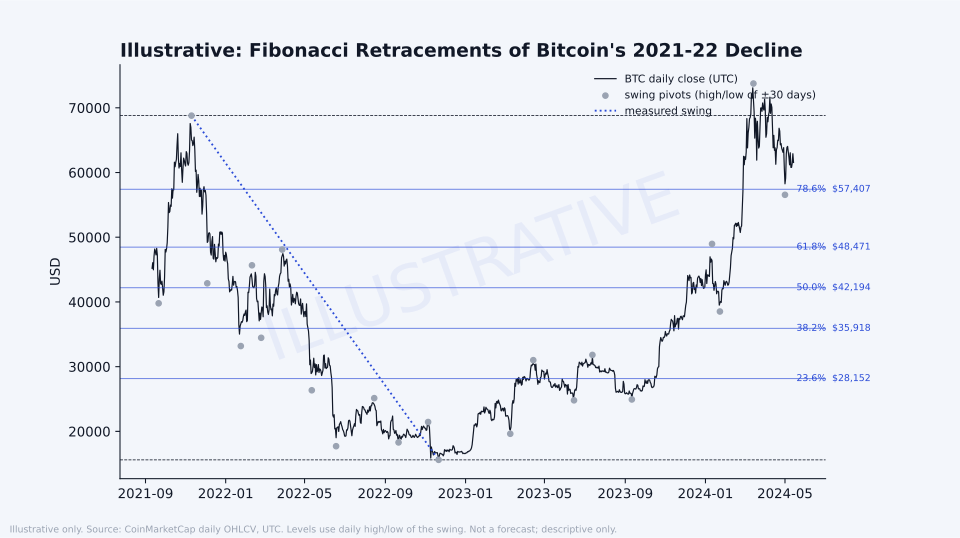
Fig. 1. Illustrative: Fibonacci retracements of bitcoin's 2021-22 decline. Prices and market data: CoinMarketCap, https://coinmarketcap.com, accessed Oct. 22, 2026, 12:24 a.m. ET. Le Coin calculation.
Fig. 2. Illustrative: the same levels drawn on bitcoin's rise from the November 2022 low to its October 2025 high ($126,198.07).
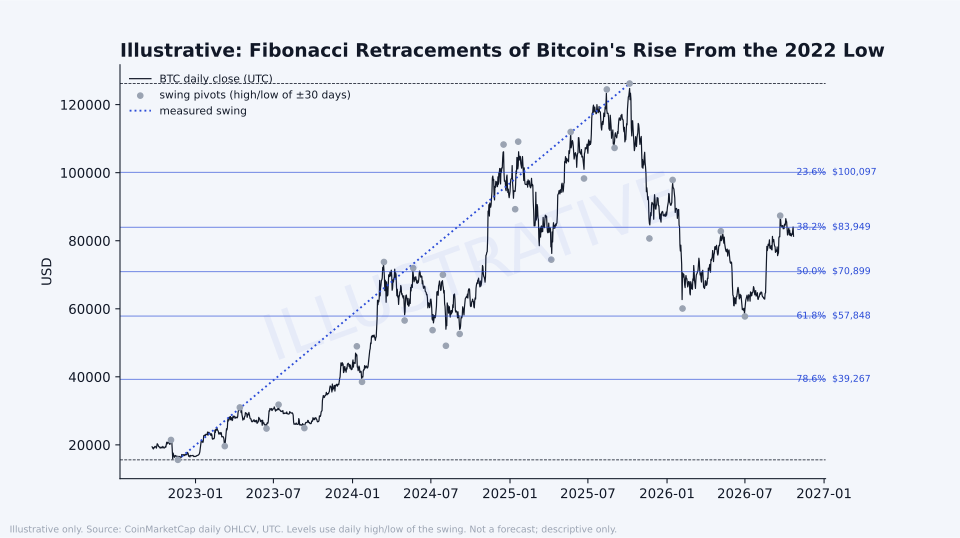
Fig. 2. Illustrative: Fibonacci retracements of bitcoin's rise from the 2022 low. Prices and market data: CoinMarketCap, https://coinmarketcap.com, accessed Oct. 22, 2026, 12:24 a.m. ET. Le Coin calculation.
The two charts show how the levels are drawn. With only two swings, there is no sample for statistics, and none is given. Price passing through a level says nothing on its own about what followed, and the levels sit close together, so price reaching one of them is common by construction.
4. Pullbacks to an average
In common usage, a pullback is a move back toward a moving average during a trend. The 50-day exponential moving average, which weights recent closes more heavily, is a common choice; how such averages are built is covered in Le Coin's entry on moving averages and oscillators (source 3). The Ichimoku Kijun-sen is described the same way. It is the midpoint of the past 26 days' range, from the system TradingView credits to Goichi Hosoda (source 2). This entry has no data on either kind of pullback.
5. The objection
Everything here depends on choices. A different swing window, 10 days or 60 instead of 30, picks different swings and therefore different levels. Swings chosen after the fact will always look tidy. CoinMarketCap's highs and lows are aggregated across venues, so a single exchange's chart can differ by a few hundred dollars and place a level elsewhere.
6. The tell
In Le Coin's view, structure and Fibonacci levels are best read as a vocabulary for describing a chart that has already been drawn. They name what price did; they do not show that any level works.
Sources
- 1TradingView support, "Auto Fib Retracement," https://www.tradingview.com/support/solutions/43000585089-auto-fib-retracement/, accessed Oct. 23, 2026, 4:21 p.m. ET.
- 2TradingView support, "Ichimoku Cloud," https://www.tradingview.com/support/solutions/43000589152-ichimoku-cloud/, accessed Oct. 23, 2026, 4:17 p.m. ET.
- 3Le Coin Field Guide, "Moving averages and oscillators: how chart tools smooth and score price moves," /field-guide/moving-averages-oscillators, accessed Oct. 23, 2026, 4:18 p.m. ET.
- 4Prices and market data: CoinMarketCap, https://coinmarketcap.com, accessed Oct. 22, 2026, 12:24 a.m. ET; Le Coin Digital Assets Expert calculation from CoinMarketCap Pro API daily OHLCV (v2 ohlcv/historical) for BTC (July 14, 2010 to Oct. 22, 2026) and ETH (Aug. 8, 2015 to Oct. 22, 2026), files last refreshed Oct. 23, 2026, 6:16 a.m. ET. BTC only; daily highs and lows; swing pivots on a 61-day centred window; Fibonacci levels of two hand-picked swings; illustrative, with no statistics; full pivot list in the research pack.Holding the Corner.
Not financial advice.