Field Guide Metrics
Relative strength index: how a momentum gauge scores recent moves
Wilder's momentum gauge, how its creator and later analysts read its 70 and 30 lines and divergences, and what bitcoin and ether history shows.
1. How to read it / Where it misleads
RSI, the relative strength index, is a momentum gauge widely quoted on crypto charts. Its creator labelled readings above 70 "overbought" and below 30 "oversold," and divergences, where price and RSI disagree, are read as possible signs of a reversal (source 1). This entry explains what RSI measures, how its creator and later analysts read it, and what bitcoin and ether history shows after past readings.
This explains how an indicator is calculated and described. It is not a signal, forecast or recommendation, and past behaviour does not predict prices.
2. Where it comes from
J. Welles Wilder Jr., a mechanical engineer turned commodities trader, introduced RSI in his 1978 book New Concepts in Technical Trading Systems (source 1). How the formula works, and why its smoothing method makes readings differ across platforms, is covered in Le Coin's entry on moving averages and oscillators (source 2).
3. What it measures
RSI compares the size of recent gains with the size of recent losses and scales the result from 0 to 100. A reading near 100 means nearly all recent movement was upward; near 0, nearly all downward. The usual window is 14 periods, and Wilder's smoothing carries every past move forward with shrinking weight (sources 1 and 2). RSI measures the speed of the move, not the level of the price.
4. How its creator and later analysts read it
Wilder treated readings above 70 as overbought and below 30 as oversold, with 50 meaning no trend (source 1). TradingView notes that some traders find those bands too wide and use 80 and 20 instead (source 1).
Divergence is the second reading. A bullish divergence is a new price low with a higher RSI low; a bearish divergence is a new price high with a lower RSI high. Wilder read these as signs of a coming reversal. Andrew Cardwell, a later RSI analyst, disagreed: he held that bullish divergences occur only in downtrends and usually mark brief corrections, and used RSI to confirm trends rather than to anticipate their end (source 1).
Fig. 1. Bitcoin on a log-scale price chart, where equal distances show equal percentage moves, with RSI crosses below 30 (n = 36) and above 70 (n = 48) marked, after a 30-day whipsaw rule, which ignores a repeat of the same event within 30 days, and the RSI panel beneath.
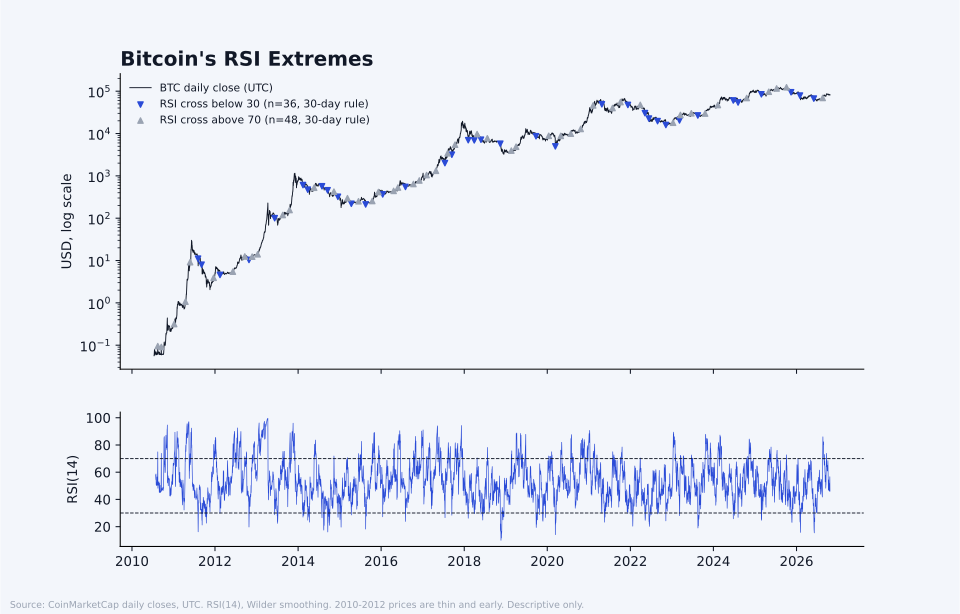
Fig. 1. Bitcoin's RSI extremes. Prices and market data: CoinMarketCap, https://coinmarketcap.com, accessed Oct. 22, 2026, 12:24 a.m. ET. Le Coin calculation.
5. What the history shows
Le Coin's Digital Assets Expert computed 14-day Wilder RSI on UTC daily closes for bitcoin from 2010 and ether from 2016, ignoring any event that repeated the same type within 30 days (source 3). Bitcoin crossed above 70 on 48 occasions and below 30 on 36; ether did so 35 and 20 times.
Bitcoin's readings above 70 were followed by gains more often than its readings below 30. Thirty days after a cross above 70, the price was higher in 39 of 48 cases; after a cross below 30, in 17 of 36. Ether showed the same direction: 20 of 35 after crosses above 70, and 5 of 20 after crosses below 30. The samples are small and overlapping.
Divergences were mixed. Using a pivot rule, which treats a day as a turning point only if its close is the lowest or highest within five days either side and so confirms it five days later, bitcoin had 17 bullish and 20 bearish divergences; the price was higher 30 days later in 13 of 17 and 12 of 20 cases. Ether had 15 and 19, with 11 of 15 and 10 of 19 higher.
Fig. 2. Past forward returns after RSI zone crosses and divergences, for bitcoin and ether. Each cell holds 13 to 48 cases.
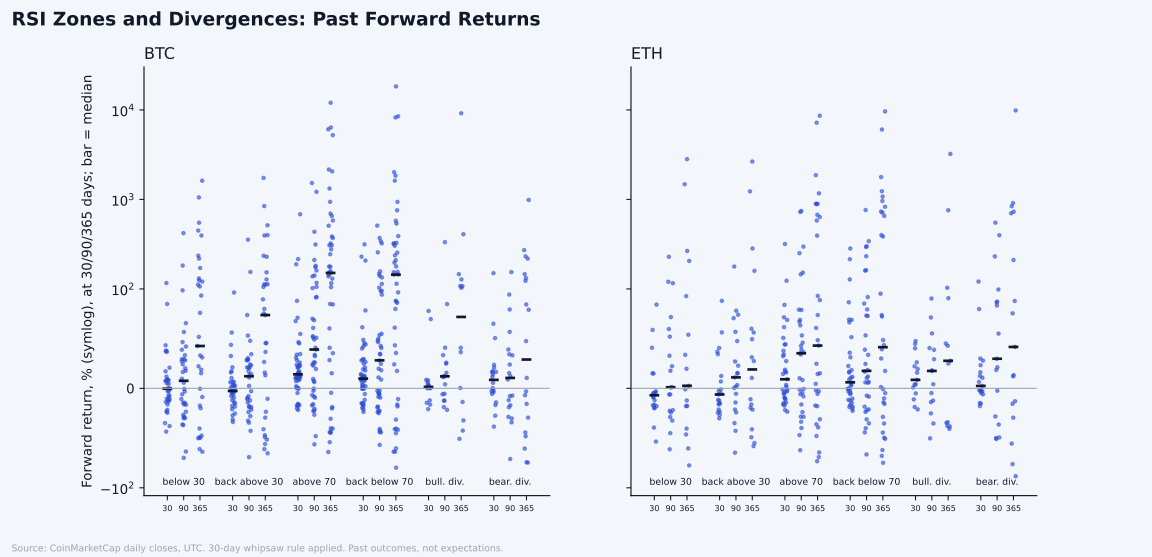
Fig. 2. RSI zones and divergences: past forward returns. Prices and market data: CoinMarketCap, https://coinmarketcap.com, accessed Oct. 22, 2026, 12:24 a.m. ET. Le Coin calculation.
6. The objection
The samples are small: one case moves the share of positive outcomes by 2 to 8 points. Most one-year windows overlap, 46 of 47 for bitcoin's crosses above 70, so the cases are not independent, and the long-run rise in both coins lifts the one-year figures for every event type. Divergence counts also depend on the pivot window and the 10 to 60 day gap chosen; other choices give different counts.
7. The tell
In Le Coin's view, RSI is best read as a speedometer. A high reading says a move has been fast and one-sided; it describes the speed of moves already made, not where the price goes next.
Sources
- 1TradingView support, "Relative Strength Index (RSI)," https://www.tradingview.com/support/solutions/43000502338-relative-strength-index-rsi/, accessed Oct. 23, 2026, 4:18 p.m. ET.
- 2Le Coin Field Guide, "Moving averages and oscillators: how chart tools smooth and score price moves," /field-guide/moving-averages-oscillators, accessed Oct. 23, 2026, 4:18 p.m. ET.
- 3Prices and market data: CoinMarketCap, https://coinmarketcap.com, accessed Oct. 22, 2026, 12:24 a.m. ET; Le Coin Digital Assets Expert calculation from CoinMarketCap Pro API daily OHLCV (v2 ohlcv/historical) for BTC (July 14, 2010 to Oct. 22, 2026) and ETH (Aug. 8, 2015 to Oct. 22, 2026), files last refreshed Oct. 23, 2026, 6:16 a.m. ET. RSI(14) with Wilder smoothing; forward changes over 30, 90 and 365 calendar days; 30-day whipsaw rule; 5-day pivot rule; full tables in the research pack.Holding the Corner.
Not financial advice.