
Field Guide Metrics
Golden and death crosses: what long-run price averages measure
What chart watchers mean by a golden cross, a death cross and a price crossing its long-run average, and what bitcoin and ether history does and does not show.
1. How to read it / Where it misleads
Bitcoin and ether have risen and fallen by wide margins in the year after crossing their long-run price averages, and the record behind the most quoted chart signals rests on a few dozen past cases. Those signals come from comparing a price with its own long-run averages. A "golden cross," a "death cross" and a price slipping under its 200-day average are phrases that turn up in market commentary whenever bitcoin or ether moves sharply. This entry explains what each one describes and sets out how bitcoin and ether behaved after past occurrences.
How a moving average is built, and why it trails the price, is covered in Le Coin's Field Guide entry on moving averages and oscillators (source 2). This entry builds on it.
This explains what the terms describe. It is not a signal, forecast or recommendation.
2. What a moving-average signal is
A moving-average signal is a date on which one line on the chart crosses another. The lines are averages of daily closing prices over a fixed number of days, most often 50 and 200. A crossing marks the point where recent prices have moved far enough, for long enough, to pull a shorter average past a longer one, or to carry the price itself across an average.
The averages can be simple, weighting each day equally, or exponential, giving recent days more weight. An exponential average reacts faster, so its crosses tend to come earlier. The figures in this entry use simple averages.
Each signal here uses the daily close at the end of the UTC day, the time standard used by CoinMarketCap's daily data (source 1). Because crypto trades around the clock, another provider with another cutoff can date the same crossing a day apart.
3. Golden cross
A golden cross is the day the 50-day average rises above the 200-day average, after sitting at or below it the day before. It means prices over roughly the past two and a half months have averaged higher than prices over roughly the past seven months. In market commentary the term is used as a label for an upward trend; it describes prices that have already risen. Bitcoin had 13 golden crosses (n = 13) and ether 11 (n = 11) in the counted history.
Fig. 1. Bitcoin golden crosses, marked on a log-scale price chart, where equal distances show equal percentage moves. There were 13 of them (n = 13), from 2012 to Sept. 2026.
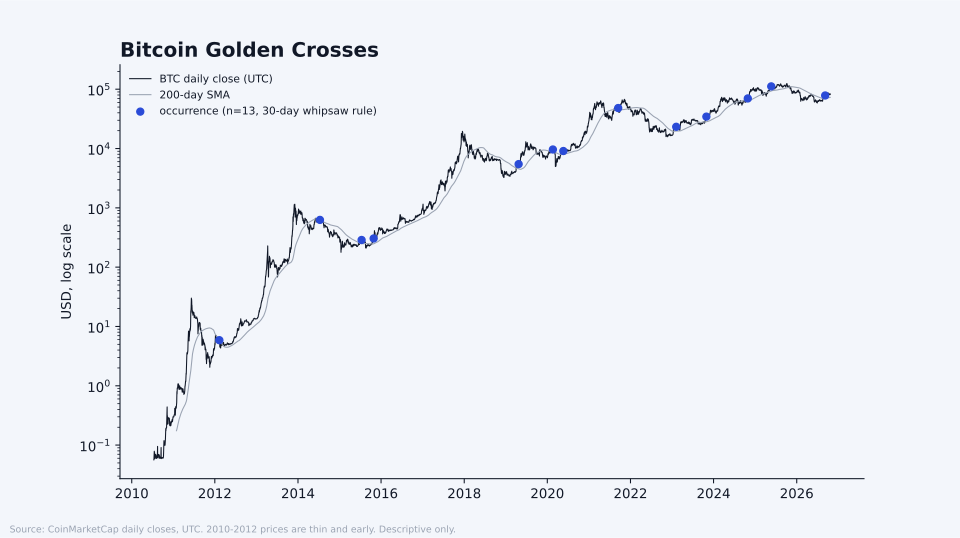
Fig. 1. Bitcoin golden crosses, n = 13. Prices and market data: CoinMarketCap, https://coinmarketcap.com, accessed Oct. 22, 2026, 12:24 a.m. ET. Le Coin calculation.
4. Death cross
A death cross is the reverse: the day the 50-day average falls below the 200-day average after sitting at or above it. In market commentary the term is used as a label for a downward trend; like the golden cross, it describes prices that have already moved. Bitcoin had 13 death crosses (n = 13) and ether 11 (n = 11) in the counted history.
Fig. 2. Bitcoin death crosses, marked on the same log-scale chart. There were 13 (n = 13), from 2011 to Nov. 2025.
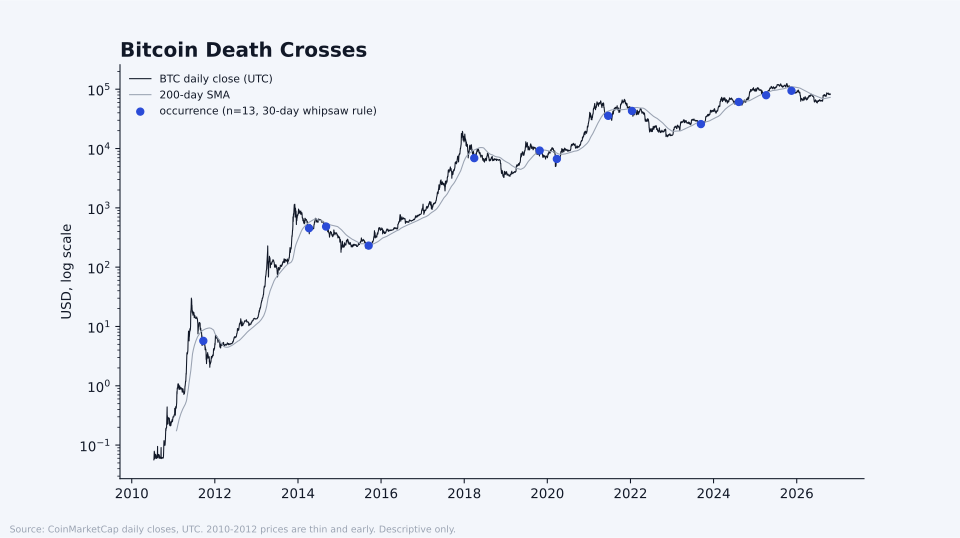
Fig. 2. Bitcoin death crosses, n = 13. Prices and market data: CoinMarketCap, https://coinmarketcap.com, accessed Oct. 22, 2026, 12:24 a.m. ET. Le Coin calculation.
5. Price crossing its 200-day average
A simpler event is the daily close itself crossing the 200-day average: a close above it after a close at or below it the day before, or the reverse. These crossings happen far more often than the 50/200 crosses, because a single day's price can swing back and forth across a slow line. In market commentary the 200-day average is often used as a reference line for longer-term trend. Bitcoin closed back above its 200-day average 48 times and below it 48 times; ether did each 31 times.
To avoid counting the same choppy stretch many times, this entry applies a 30-day whipsaw rule. A crossing is set aside if another crossing of the same type happened in the previous 30 days. Under that rule bitcoin has 24 closes above and 19 closes below, and ether 16 above and 18 below. The rule removed none of the 50/200 crosses, since none repeated within 30 days.
Fig. 3. Past one-year returns after closes back above the 200-day average, one dot per case. Bitcoin rose a year later in 15 of 23 cases (n = 23) and ether in 8 of 14 (n = 14).
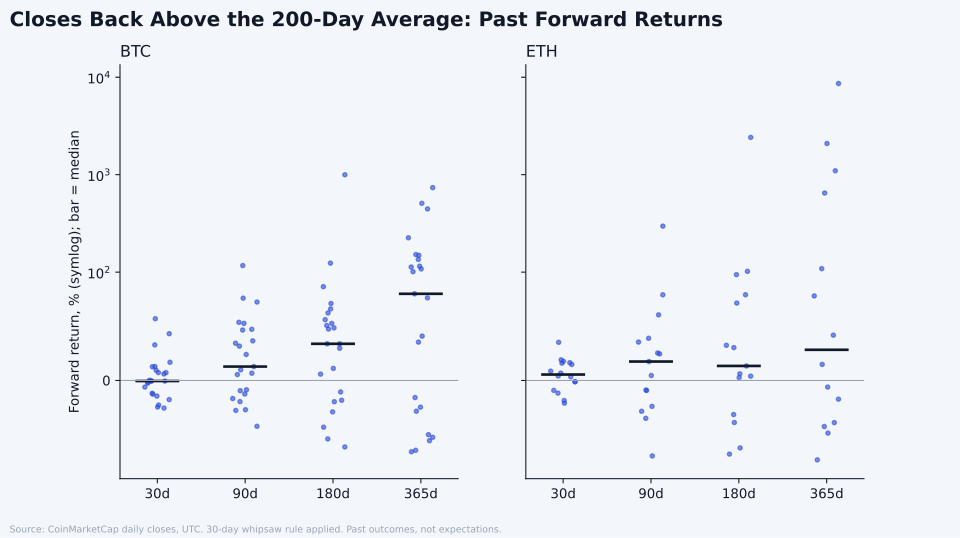
Fig. 3. Closes back above the 200-day average: past forward returns, BTC n = 23, ETH n = 14 at 365 days, after the 30-day whipsaw rule. Prices and market data: CoinMarketCap, https://coinmarketcap.com, accessed Oct. 22, 2026, 12:24 a.m. ET. Le Coin calculation.
Fig. 4. Past one-year returns after closes below the 200-day average. Bitcoin was higher a year later in 10 of 19 cases (n = 19) and ether in 9 of 17 (n = 17).
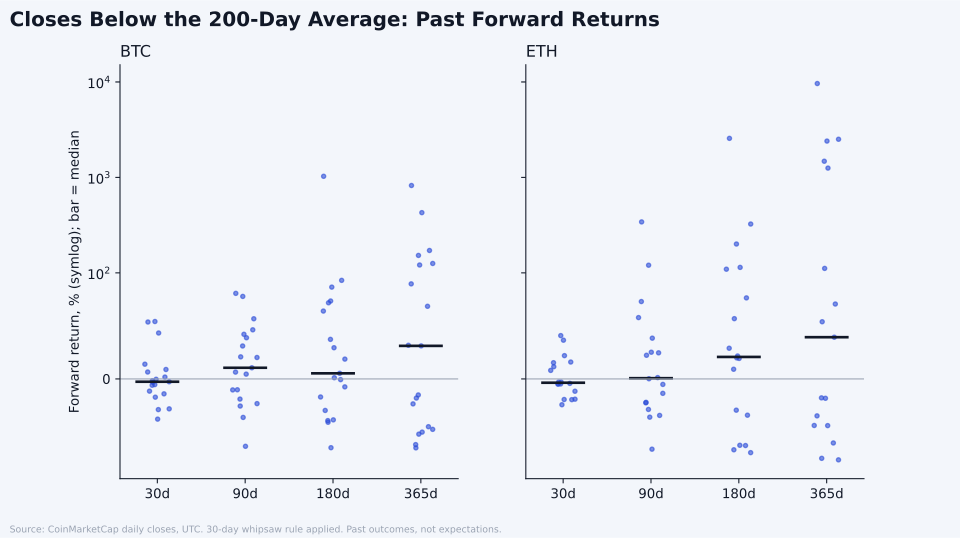
Fig. 4. Closes below the 200-day average: past forward returns, BTC n = 19, ETH n = 17 at 365 days, after the 30-day whipsaw rule. Prices and market data: CoinMarketCap, https://coinmarketcap.com, accessed Oct. 22, 2026, 12:24 a.m. ET. Le Coin calculation.
6. The 200-week average
Some bitcoin commentary uses a much slower line, the average of the last 200 weekly closes, with each week ending on Sunday's UTC close. It first became available in mid-2014. Each week's value is applied from the following Monday, so no day is measured against information from later in its own week.
Here a "touch" is a day when bitcoin's daily low reaches or falls below the 200-week average after the previous day closed above it. It therefore counts approaches from above only. It covers both brief intraday dips and closes through the line. Bitcoin had 57 such touches, or 9 (n = 9) after the 30-day whipsaw rule.
Fig. 5. Bitcoin's touches of its 200-week average, marked on a log-scale price chart. After the whipsaw rule there are 9 (n = 9), the latest on June 4, 2026.
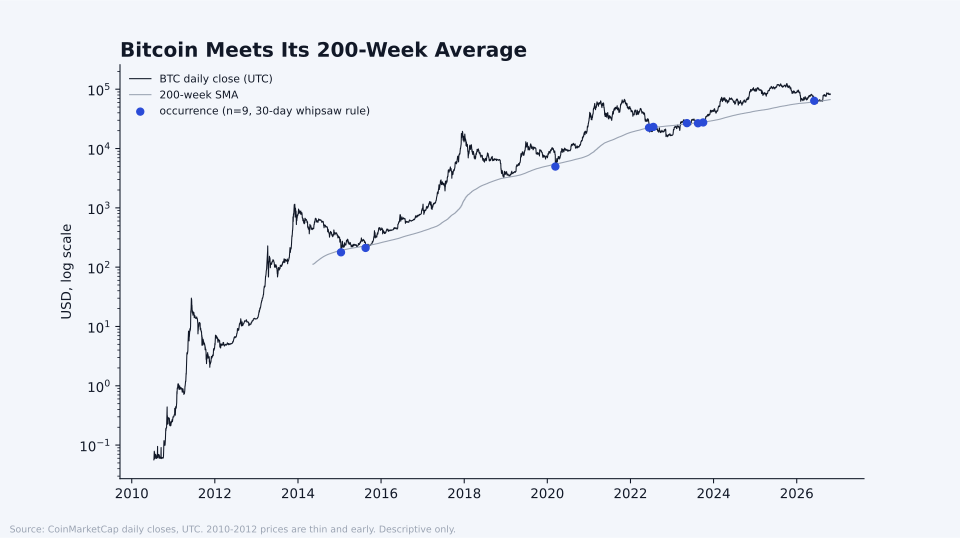
Fig. 5. Bitcoin touches of its 200-week average, n = 9 after the 30-day whipsaw rule. Prices and market data: CoinMarketCap, https://coinmarketcap.com, accessed Oct. 22, 2026, 12:24 a.m. ET. Le Coin calculation.
7. What history shows
The figures below measure the change from the close on the event day to the close a set number of calendar days later, using the whipsaw-rule set. Bitcoin's series starts in July 2010, and its 2010 to 2012 prices are thin and early, from low volume on few venues; that period includes a Sept. 22, 2011 death cross and a Feb. 10, 2012 golden cross. Ether events are counted from 2016, with 2015 prices used only to build the first averages. Recent events whose windows have not finished are left out of each count.
| Event | Asset | Higher after 365 days | Median 365-day change |
|---|---|---|---|
| Golden cross | BTC | 9 of 12 | +100.6% |
| Golden cross | ETH | 7 of 10 | +59.7% |
| Death cross | BTC | 6 of 12 | +15.9% |
| Death cross | ETH | 6 of 10 | +51.9% |
| Close above 200-day | BTC | 15 of 23 | +80.0% |
| Close above 200-day | ETH | 8 of 14 | +28.3% |
| Close below 200-day | BTC | 10 of 19 | +31.1% |
| Close below 200-day | ETH | 9 of 17 | +39.3% |
| 200-week touch | BTC | 8 of 8 | +123.9% |
Prices and market data: CoinMarketCap, https://coinmarketcap.com, accessed Oct. 22, 2026, 12:24 a.m. ET. Le Coin calculation; whipsaw-rule set.
The spread around those medians is wide. A year after bitcoin golden crosses, changes ran from −59.1% to +436.5% (n = 12); after bitcoin death crosses, from −51.4% to +673.9% (n = 12). Over 30 days, bitcoin was higher after 5 of 13 death crosses (n = 13), with a median change of −2.9%. Ether's 2016 and 2017 rally produced changes in the thousands of percent, up to +7,297.9% after one golden cross (n = 10), which is why medians are shown rather than averages.
All 8 bitcoin 200-week touches with a full year of data (n = 8) were followed by a higher price a year later, with changes from +15.3% to +1,053.4%. Over 30 days, bitcoin was higher after 4 of 9 touches (n = 9). The June 4, 2026 touch has no full year yet.
8. Limits
The samples are small. After the whipsaw rule, each count above holds between 8 and 24 cases, so one case moves the share that rose by about 4 to 13 percentage points.
The windows overlap. When two events fall less than a year apart, their one-year windows share days, and the cases are not independent. Six of the 12 bitcoin golden-cross windows overlap with an earlier one. Bitcoin's four-year halving cycles, the scheduled cuts in new bitcoin issued to miners, also group several events into the same rally or slump.
The 200-week result is the clearest case. Eight of eight is a small, overlapping sample: 5 of those 8 windows overlap, and several sit inside the same few rallies. It is not a reliable pattern, and it says nothing about what follows the next touch.
In Le Coin's view, these crossings are best read as labels for what prices have already done, not as information about what they will do next. Past behaviour does not predict future prices.
Sources
- 1Prices and market data: CoinMarketCap, https://coinmarketcap.com, accessed Oct. 22, 2026, 12:24 a.m. ET; Le Coin Digital Assets Expert calculation from CoinMarketCap Pro API daily OHLCV (v2 ohlcv/historical) for BTC (July 14, 2010 to Oct. 22, 2026) and ETH (Aug. 8, 2015 to Oct. 22, 2026), files last refreshed Oct. 23, 2026, 6:16 a.m. ET. Simple 50-day, 200-day and 200-week averages of UTC daily closes; forward changes over 30, 90, 180 and 365 calendar days; 30-day whipsaw rule; full tables in the research pack.
- 2Le Coin Field Guide, "Moving averages and oscillators: how chart tools smooth and score price moves," /field-guide/moving-averages-oscillators, accessed Oct. 23, 2026, 4:07 p.m. ET.Holding the Corner.
Not financial advice.