
Markets · Liquidations
Ether long liquidations hit harder than bitcoin's, size for size
In Saturday's slide, ether's 24-hour long liquidations were about 71% of bitcoin's while ether's market capitalization was only about 17.5% of bitcoin's, per CoinMarketCap windows cited below.
Ether's leveraged long book took a hit out of proportion to its size in Saturday's crypto slide. Over the 24 hours covered by CoinMarketCap's about 3:05 p.m. ET liquidation window, ether's long liquidations were about 71% of bitcoin's, while ether's market capitalization in the about 1:07 p.m. ET top-20 snapshot was only about 17.5% of bitcoin's [1]. Split by side, with shorts before longs: ether saw about $17.8M in shorts and $170.6M in longs; bitcoin saw about $18.6M in shorts and $240.3M in longs. The market caps behind the 17.5% ratio were about $282.6 billion for ether and about $1,610.6 billion for bitcoin [1].
Those windows do not line up to the minute. The liquidation file is an hourly CoinMarketCap derivatives pull with last_updated near 3:04 p.m. ET; the market-cap file is the top-20 intraday job whose header reads 13:07 ET. Le Coin joined them for a same-day size-for-size read, not a tick-matched book [1]. The Block published a related comparison earlier Saturday; the numbers and chart here are Le Coin's own CoinMarketCap calculation.
What a liquidation measures
A liquidation is a leveraged derivatives position an exchange forcibly closes when margin runs out. CoinMarketCap reports the USD value of those closures on the contracts it tracks, split into short liquidations and long liquidations. This piece follows that split and does not add shorts and longs into a single "total liquidations" figure for any coin [1].
Size-for-size here means dividing a coin's long liquidations by its market capitalization, expressed as USD millions of long liquidations per $1 billion of market cap. That rescales a large market and a smaller one onto the same ruler. Absolute dollar long liquidations still matter for how much long risk was cleared; the per-$1B measure answers a different question: how hard the forced long closings hit relative to the coin's listed size.
Evidence from Saturday's windows
Fig. 1. Ranks selected large coins by long liquidations only, per $1 billion of market cap, using the same CoinMarketCap join [1]. Near Protocol leads at about $3.93M of longs per $1B of market cap, then Hyperliquid (HYPE) at about $1.18M and Zcash at about $1.08M. Ether prints about $0.60M. Solana is about $0.52M. Bitcoin is about $0.15M. BNB is about $0.04M.
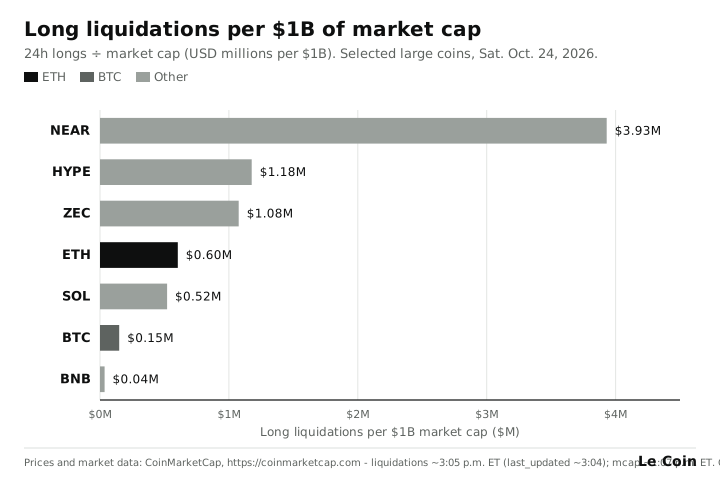
On that longs-only ruler, ether's per-$1B print is about four times bitcoin's ($0.60M versus $0.15M). That matches the absolute long books versus market caps: ether's longs were about 71% of bitcoin's while ether's market cap was about 17.5% of bitcoin's, and ether still cleared fewer absolute long dollars than bitcoin ($170.6M versus $240.3M) [1].
Other large names sit between the extremes. Solana's longs-per-$1B figure is near ether's. HYPE and Zcash clear more than $1M of longs per $1B. Near Protocol's reading is an order of magnitude above bitcoin's on this scale, on a much smaller market cap. BNB sits near the bottom of the set. The chart is a cross-section of one Saturday window, not a ranking of which market is "safer" [1].
For context on the raw books, still with shorts before longs: solana about $1.9M shorts and $30.8M longs; HYPE about $0.3M and $22.6M; Zcash about $3.2M and $21.1M; Near Protocol about $1.1M and $22.8M; BNB about $0.7M and $3.4M [1].
The objection: a ratio is not a leverage census
One fair objection is that liquidations are outcomes, not a direct count of open interest, funding, or how much leverage traders held before the move. A quiet book can still print large liquidations if price gaps through stops; a crowded book can print little if price does not move. CoinMarketCap's figures also cover the venues and contracts in its feed, not every perpetual market in crypto [1].
A second limit is the clock. Market caps here are from the early-afternoon top-20 file; liquidations are from the mid-afternoon hourly file. Spot prices move between those stamps, so the per-$1B ratios are a same-day illustration, not a simultaneous snapshot of every trader's margin. Re-pulling either file later Saturday would change the decimals. The structural claim this piece makes is about the gap between ether's share of bitcoin's long liquidations and ether's share of bitcoin's market cap in these two windows, not about a permanent multiplier [1].
The tell
In Le Coin's view, the tell is whether the next CoinMarketCap liquidation windows keep ether's size-for-size long-liquidation print several times bitcoin's, or whether the gap narrows as Saturday's move ages. That is a description of relative forced-closing intensity across two market-cap scales. It is not a call on where ether or bitcoin trade next [1].
Sources
- Prices and market data: CoinMarketCap, https://coinmarketcap.com (liquidations accessed via Pro API liq-coin-hourly about 3:05 p.m. ET Oct. 24, 2026, last_updated about 3:04 p.m. ET; market caps via top20-intraday about 1:07 p.m. ET, file header 13:07). Join and size-for-size calc: Le Coin scan file ideas/scans/work-1024-1500/cmc-liq-vs-mcap-1505.txt and figures/2026-10-24-ether-leverage-vs-bitcoin-liquidations/fig-1-data.v1.csv. Ether: market cap about $282.6B; 24h liquidations about $17.8M shorts / $170.6M longs. Bitcoin: market cap about $1,610.6B; about $18.6M shorts / $240.3M longs. Ether/bitcoin market-cap ratio about 0.175; ether/bitcoin 24h long-liquidation ratio about 0.71. Longs per $1B market cap (selected): NEAR about $3.93M, HYPE about $1.18M, ZEC about $1.08M, ETH about $0.60M, SOL about $0.52M, BTC about $0.15M, BNB about $0.04M.
Holding the Corner.
Not financial advice.