
Markets · Market structure
Bitcoin closes below its 50-day average for first time since August
The Oct. 22 UTC close was $81,311.89 against a 50-day simple average of $81,782.29, ending 66 straight closes above. Oct. 23 closed below again. The crypto market is $217.6 billion smaller than at its Oct. 5 peak.
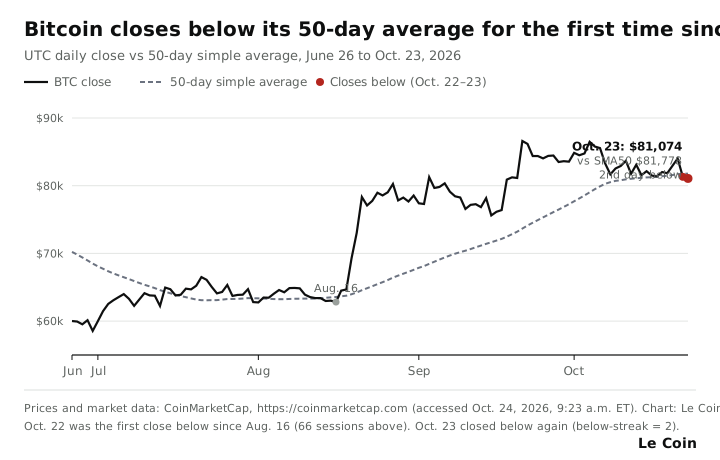
Bitcoin's Oct. 22 UTC close was $81,311.89, below its 50-day simple average of $81,782.29, the first such close after 66 straight sessions above that average, according to CoinMarketCap daily closes refreshed by Le Coin's Digital Assets Expert desk [1]. The previous close below the same average was Aug. 16. Oct. 23 closed below again, at $81,074.19 against a 50-day average of $81,778.34, so the below-streak through Oct. 23 is two sessions [1]. Separately, the total value of the crypto market fell from about $2.938 trillion on Oct. 5 to about $2.720 trillion on Oct. 23, a decline of 7.4%, or $217.6 billion [2].
What the 50-day average measures
A 50-day simple average is the mean of the last 50 UTC daily closes. It is a widely watched summary of bitcoin's recent price level, not a forecast of where the next close will land. When the close sits above that average for many sessions in a row, the market has been trading higher than its own near-term mean. A close below it ends that stretch. It does not, by itself, say whether the next week will be higher or lower.
Le Coin used CoinMarketCap's UTC daily closes and the 50-day simple average computed from those closes, with a live append for the Oct. 23 row accessed at 9:23 a.m. ET on Oct. 24 [1]. The figure series runs from June 26 through Oct. 23, 2026.
Two sessions below, after 66 above
Fig. 1. From Aug. 17 through Oct. 21, every UTC close was at or above the 50-day average: 66 sessions. On Oct. 22 the close was about $470 below the average. On Oct. 23 it was about $704 below. The chart marks Aug. 16, the prior close below, and the Oct. 22–23 pair [1].
That break arrives as the broader market sits well below its early-October peak. CoinMarketCap's total crypto market capitalization was about $2.938 trillion on Oct. 5 and about $2.720 trillion on Oct. 23 [2]. Bitcoin's share of that total, often called dominance, was 60.08% on Oct. 23 [2]. As of about 6:21 a.m. ET on Oct. 24, CoinMarketCap showed bitcoin near $80,434, about 36% below its all-time high of $126,198 set on Oct. 6, 2025 [3]. Intraday spot is context only; the structure facts in this piece are the Oct. 22 and Oct. 23 closes versus the 50-day average and the Oct. 5 to Oct. 23 market-cap change.
How to read a short stretch below
A moving average lags. It is built from the past 50 closes, so a sharp drop can put the latest close below an average that still reflects higher prices from earlier in the window. The reverse is also true on the way up. Two sessions below the average after 66 above is a change in position relative to that mean. It is not, on its own, a map of what comes next.
The Oct. 22 cross is the first break of that kind since Aug. 16. Oct. 23 kept the close on the same side of the average. Whether later sessions stay below or reclaim the average is a separate fact, measured the same way: close versus the mean of the prior 50 UTC closes [1].
The objection: averages are not the market
Critics of moving-average stories say the average is just arithmetic on recent prices, so calling a cross meaningful confuses a description with a decision rule. That objection is fair if the average is treated as a trigger. This piece does not. The 50-day figure here is a ruler for where the Oct. 22 and Oct. 23 closes sat relative to the prior 50 days, placed next to a separate fact: the market's capitalization is $217.6 billion below its Oct. 5 high [1][2].
A second limit is scope. The average is bitcoin alone. The market-cap drawdown covers the whole crypto market. Dominance near 60% says bitcoin still accounts for most of that total, but it does not say whether other large coins moved with bitcoin on those two days [2].
The tell
In Le Coin's view, the tell is whether closes after Oct. 23 stay below the 50-day average or reclaim it, read against the market-cap path from the Oct. 5 peak. That is a description of position, not a call on direction.
Sources
Prices and market data: CoinMarketCap, https://coinmarketcap.com (accessed Oct. 24, 2026, 9:23 a.m. ET). BTC UTC daily closes and 50-day simple average through Oct. 23, 2026; Le Coin Digital Assets Expert pack.v1 (sha256 b1044b479f1c8bbbe373b536947295ae2f3573c6d4cc5d0375815e5717e7f920). Oct. 22 close $81,311.89 vs 50-day simple average $81,782.29 (first below since Aug. 16 after 66 closes above). Oct. 23 close $81,074.19 vs $81,778.34 (below by $704.15); consecutive closes below through Oct. 23 = 2.
Prices and market data: CoinMarketCap, https://coinmarketcap.com (accessed Oct. 24, 2026, 9:23 a.m. ET). Total crypto market capitalization about $2.938 trillion on Oct. 5, 2026, and about $2.720 trillion on Oct. 23, 2026 (−7.4%, −$217.6 billion); bitcoin dominance 60.08% on Oct. 23 (global metrics).
Prices and market data: CoinMarketCap, https://coinmarketcap.com (accessed Oct. 24, 2026, 6:21 a.m. ET). BTC spot about $80,434; all-time high $126,198 on Oct. 6, 2025 (about 36% below).
Holding the Corner.
Not financial advice.