Stablecoin supply barely grew over the past year while payments activity nearly doubled, according to BitGo Research citing data provider Allium. September's average stablecoin supply was $273.7 billion, against $262.2 billion a year earlier, roughly 4% higher, and still under the April 2026 peak of $281.2 billion. Over the same September-to-September window, adjusted payments volume as reported by BitGo Research using Allium data rose to $54.1 billion from $28.5 billion, the highest monthly print in that series [1].
BitGo Research published the figures on Oct. 26, 2026, in a Money20/20 takeaways note by Greg Cipolaro, BitGo's head of research. Le Coin charts the stated year-over-year point pairs only. The post does not publish a downloadable full monthly time series, and Allium was not pulled independently here [1].
What the two meters measure
Average supply is the stock of stablecoins outstanding — how many dollar-linked tokens sit onchain in a month. Adjusted payments volume is a flow: BitGo's Allium-based read of payments activity in a month, not a count of every transfer. BitGo frames the gap between a flat stock and a rising flow as faster turnover: the same roughly $270 billion pool doing more commerce work, without needing new minting to match the payments rise [1].
That framing is about rails, not a price call. BitGo's conference color is that networks are putting stablecoins behind existing products, for example Visa Direct USDC prefunding that leaves the recipient paid into a bank account or card as before. The chart story below is the data claim; the conference examples stay secondary [1].
Evidence from the September prints
Fig. 1. Puts the two September year-over-year pairs side by side. On the left, average supply moves from $262.2 billion to $273.7 billion. On the right, adjusted payments move from $28.5 billion to $54.1 billion, nearly double [1].
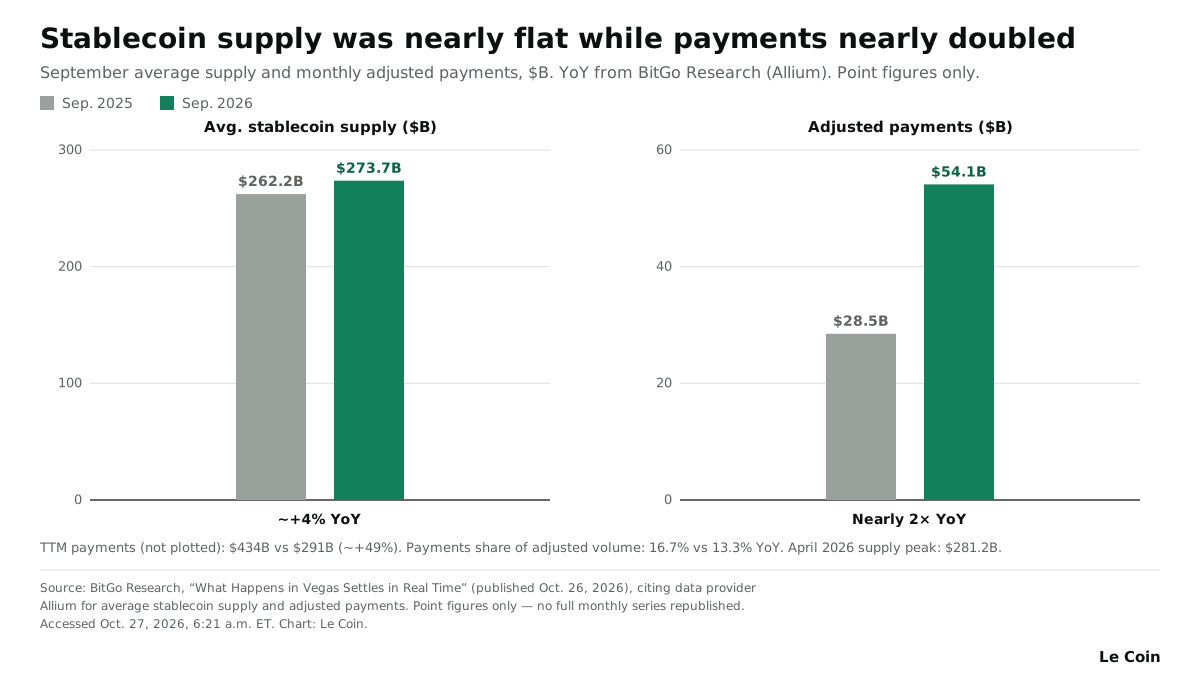
Trailing-twelve-month payments reinforce the monthly print: $434 billion in the year through September 2026, versus $291 billion in the prior twelve months, about a 49% increase. Payments' share of adjusted volume rose to 16.7% in September from 13.3% a year earlier [1].
Issuer mix helps explain why the stock stayed quiet. BitGo, citing Allium, says USDT barely moved since December ($191.4 billion versus $191.9 billion), USDC sat in a $70 billion to $77 billion band all year, and newer entrants PYUSD, USDG, and RLUSD together were about $6.5 billion, not enough to lift the total [1].
The objection: one research cut, not a census
A fair objection is that these are BitGo Research figures attributed to Allium, not a Le Coin rebuild of every chain and issuer. "Adjusted" is BitGo/Allium's cut; this piece does not independently verify which transfers are kept or dropped. BitGo's related note that some adjusted volumes exclude certain non-economic activity is a reminder that methodology choices move the level, even when the year-over-year direction is clear in their tables [1].
Another limit is coverage of the series itself. The chart uses the published September 2025 and September 2026 point figures. It is not a digitized copy of BitGo's blog images, and it is not a full monthly path. A later Allium or BitGo refresh could revise the decimals without erasing the qualitative gap BitGo highlights between a nearly flat stock and a much larger payments flow [1].
The tell
In Le Coin's view, the tell is whether the next BitGo/Allium monthly prints keep payments rising against a still-flat supply stock, or whether supply starts to expand again as the payments line cools. That is a description of how hard each dollar of stablecoin supply is working in this research cut. It is not a call on where any token or issuer trades next [1].
Sources
- BitGo Research, Greg Cipolaro (Head of Research), "What Happens in Vegas Settles in Real Time," https://www.bitgo.com/resources/blog/what-happens-in-vegas-settles-in-real-time/ (published Oct. 26, 2026; schema datePublished 2026-10-26). Accessed about 6:21 a.m. ET Oct. 27, 2026. Allium-cited figures as stated: September average stablecoin supply $273.7B vs $262.2B a year earlier (
4% YoY), under April 2026 peak $281.2B; adjusted payments volume $54.1B vs $28.5B (series high); TTM payments $434B vs $291B (+49%); payments share of adjusted volume 16.7% vs 13.3%; USDT $191.4B vs $191.9B since December; USDC $70–$77B band; PYUSD+USDG+RLUSD ~$6.5B. Le Coin Fig. 1 from stated YoY point pairs only: figures/2026-10-27-bitgo-stablecoin-payments/fig-1-data.v1.csv (DAE drop/2026-10-27-bitgo-stablecoin-payments/). Allium not independently pulled. BitGo chart images not republished.
Holding the Corner.
Not financial advice.