Contracts on stocks, commodities, stock indices and currencies traded $3.98 billion on Hyperliquid in the 24 hours to 10:08 a.m. ET on Oct. 23, against $2.25 billion for the exchange's bitcoin contract, according to Le Coin's analysis of Hyperliquid's public data. That is 1.77 times as much.
Hyperliquid is a crypto exchange best known for perpetual futures, contracts that track an asset's price with no expiry date, so a trader can hold a position for as long as they keep enough collateral without ever owning the asset. Most of its volume has come from crypto. The contracts on traditional assets are launched by outside developers on the exchange's own infrastructure, and they now trade around the clock on the same system that settles crypto trades.
The 24-hour figure is the most striking, but it is also the most flattering. Over the full stretch from Apr. 1 to Oct. 22, traditional-asset contracts traded $525.2 billion against $482.3 billion for bitcoin, a ratio of 1.09, by Le Coin's calculation. They were the larger of the two on 97 of those 205 days.
Fig. 1. Daily trading volume on Hyperliquid, contracts on traditional assets combined versus the bitcoin contract, Apr. 1 to Oct. 22, 2026. Chart: Le Coin. Source: Hyperliquid public API.
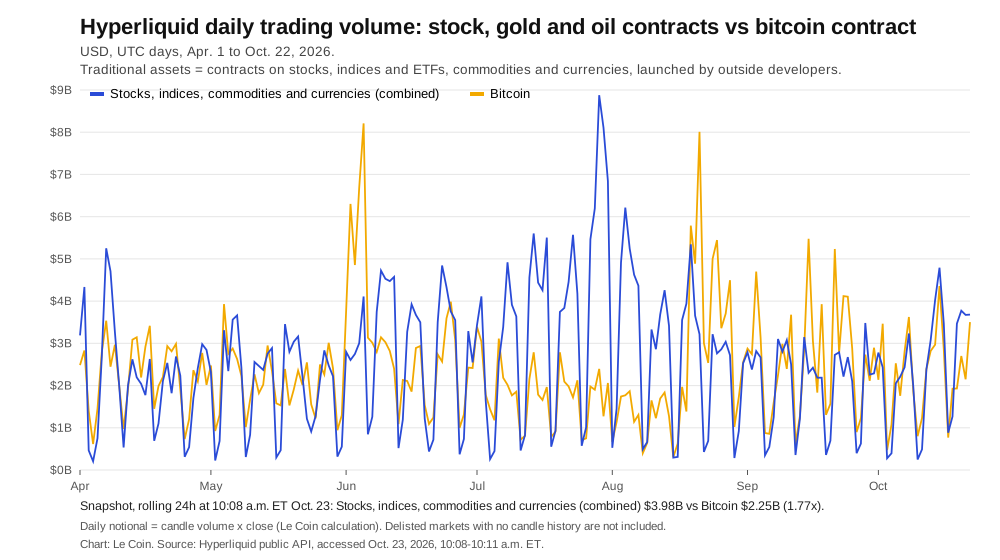
The answer depends heavily on the window. Over the last seven days, Oct. 16 to Oct. 22, traditional assets traded 1.28 times bitcoin's volume. Over the last 30 days the ratio was 0.97, slightly behind. In September alone it was 0.77. In July it was 2.00, the strongest month in the series, and the single biggest day was July 29, when traditional-asset contracts traded about $8.88 billion against $2.39 billion for bitcoin. For the third quarter as a whole the ratio was 1.24.
On the last full trading day, Oct. 22, the two were close: $3.68 billion for traditional assets and $3.50 billion for bitcoin.
The 24-hour snapshot breaks down by asset type. Single stocks made up $2.18 billion, index and ETF contracts $1.22 billion and commodities such as gold and oil $0.54 billion. Contracts on private companies yet to list added $0.04 billion and currencies and interest rates $0.01 billion. The parts add to slightly more than the total because of rounding.
These numbers give a way to test a widely shared claim. A report published on Oct. 23 by Glassnode and Fasanara Digital said that on Hyperliquid, perpetual futures on equities, indices and commodities "now trade more than four fifths as much as the venue's own Bitcoin book," citing data from Hyperliquid and Glassnode. Our data supports that for recent windows: every measure from the last 24 hours to the last 30 days is above four fifths, and several are above parity. The report does not state its window, and September on its own, at 0.77, falls just short.
The same report said those markets "first traded more than the venue's own Bitcoin perpetual in April." Hyperliquid's data does not support that as stated. By our count, traditional-asset contracts first out-traded bitcoin on a single day on Mar. 3, 2026, with about $3.87 billion against $3.73 billion, and did so on eight days in March. The first full week above bitcoin began Mar. 23. Measured by month, April came in at 0.96, still below bitcoin, and July was the first calendar month in which traditional assets traded more. April was the first month with 10 or more days above bitcoin, which may be what the report meant, but it is not what it said. Glassnode's public page does not explain its method, and Le Coin has not seen the full PDF.
The growth before April is clear in the monthly figures. The ratio was 0.26 in January, 0.44 in February and 0.81 in March, before hovering just under parity from April to June.
There are limits to what the data can show, and they all point the same way on size. The traditional-asset total is a floor. Some delisted markets returned no trading history, so their volume is missing, and 18 tickers we could not identify were left out. The daily series is our own calculation, multiplying each day's volume by the closing price, because the API gives no daily dollar total; the 24-hour snapshot uses Hyperliquid's own rolling figure. New listings added through the period account for part of the growth. Weekend volume in traditional assets also falls sharply when the underlying markets are shut, which makes daily ratios swing.
The figures cover traded volume on one exchange. They do not show open positions, who is trading or any effect on the prices of the underlying stocks or commodities.
In Le Coin's view, the direction is clear, but the size of the lead is not. Traditional-asset contracts have gone from about a quarter of bitcoin's volume in January to roughly matching it, and on that point our numbers and the Glassnode and Fasanara report agree. The month-to-month swings, from 2.00 in July to 0.77 in September, suggest the activity is still driven by bursts of interest in particular listings rather than a settled base of trading. A headline ratio from any single window should be read with that in mind.
The next useful read is whether the October level holds once the 30-day ratio rolls past September's weaker run.
Sources
- Hyperliquid public info API, https://api.hyperliquid.xyz/info (metaAndAssetCtxs for the main exchange and 10 builder exchanges listed by perpDexs; candleSnapshot daily candles for the bitcoin perpetual and 313 builder-exchange markets), accessed Oct. 23, 2026, 10:08 to 10:11 a.m. ET. The 24-hour snapshot sums the API's rolling dayNtlVlm field at 10:08 a.m. ET. Daily, weekly, monthly and window figures are Le Coin's calculations (candle volume times close, UTC days). Method note, raw responses and data file: Le Coin figure pack for this article.
- Glassnode, "Fasanara Digital + Glassnode: Q4 2026 Institutional Market Perspectives," Oct. 23, 2026, https://research.glassnode.com/fasanara-digital-glassnode-q4-2026-institutional-market-perspectives/, accessed Oct. 23, 2026, 9:27 a.m. ET. Quoted as stated; the full PDF report was not reviewed.
Holding the Corner.
Not financial advice.