1. How to read it / Where it misleads
A move that counts as quiet for bitcoin can look violent next to a large bank stock, and volatility tools put a number on that difference. Two of the most used are Bollinger Bands, which wrap a price in an envelope that widens and narrows with its swings, and average true range, or ATR, which measures how far a price typically travels in a day. This entry explains what each measures, how they are used, and what bitcoin and ether history shows.
This explains how indicators are calculated and described. It is not a signal, forecast or recommendation, and past behaviour does not predict prices.
2. Where they come from
John Bollinger, a trader and analyst, created his bands in the early 1980s to show volatility changing over time (source 2). J. Welles Wilder Jr. introduced ATR in his 1978 book New Concepts in Technical Trading Systems, the same book that introduced RSI (source 3).
3. What they measure
Bollinger Bands start from a 20-day simple moving average of closes. The upper and lower bands sit two standard deviations above and below it; a standard deviation is a measure of how widely prices have spread around their average. When prices swing harder, the bands move apart. Bandwidth, the distance between the bands as a share of the middle line, turns that into one number (source 1).
ATR measures the true range of each day: the larger of the day's high minus its low, or the gap from the prior close to that day's high or low. Wilder smoothed it, and 14 days is the most common setting (source 3). Expressed as a share of the price, it lets readers compare a quiet year with a wild one.
4. How they are used
Bollinger's own rules push back on the most common reading. A touch of the upper band "is NOT in-and-of-itself a sell signal," he writes, and prices can "walk up the upper Bollinger Band" in a trend; closes outside the bands are "initially continuation signals, not reversal signals" (source 1). His rules call identifying "The Squeeze" the most popular use of bandwidth (source 1). In common usage, a squeeze is a stretch when the bands are unusually narrow. It is described as a quiet spell, with no view on which way prices move after it.
In common usage, ATR serves as a yardstick: a description of how far a coin typically moves in a day, so that a given move can be read as large or ordinary for that market.
Fig. 1. Bitcoin's Bollinger Bands (20 days, two standard deviations) over the last two years, with squeeze starts marked. A squeeze is a stretch when the bands are unusually narrow.
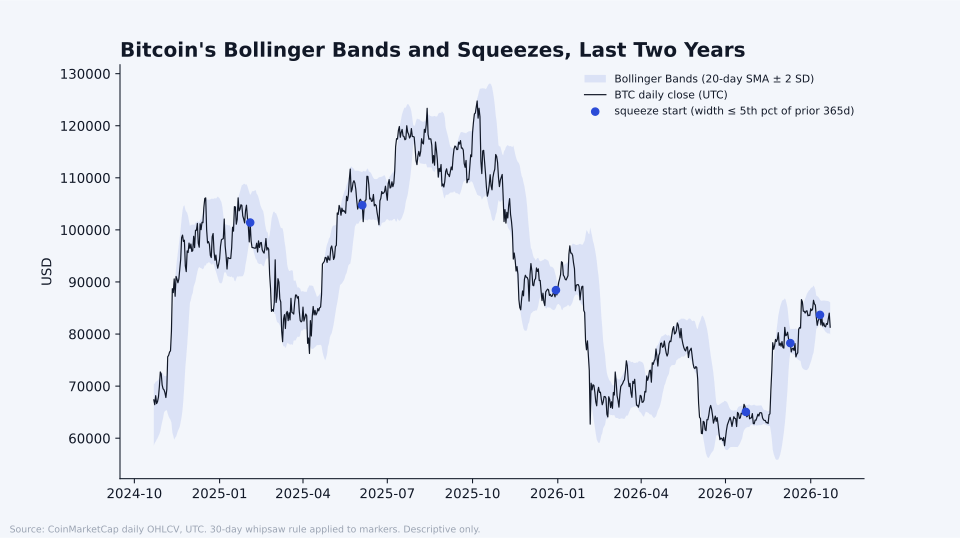
Fig. 1. Bitcoin's Bollinger Bands and squeezes, last two years. Prices and market data: CoinMarketCap, https://coinmarketcap.com, accessed Oct. 22, 2026, 12:24 a.m. ET. Le Coin calculation.
5. What the history shows
Le Coin's Digital Assets Expert counted events on UTC daily closes for bitcoin from 2010 and ether from 2016, ignoring any event that repeated the same type within 30 days, a 30-day whipsaw rule (source 4). A squeeze start is the first day bandwidth falls to or below the narrowest 5% of the prior year's readings.
Bitcoin had 36 squeeze starts on that rule, and ether 25. Thirty days after a bitcoin squeeze began, the price was higher in 17 of 35 cases, with a median change of -0.2%. That is about a coin flip. For ether it was 7 of 25 (median -6.9%).
Band closes, a daily close outside the bands, were common. Bitcoin closed above its upper band 67 times and below its lower band 59 times; ether did so 43 and 41 times. Bitcoin was higher 30 days after an upper-band close in 38 of 67 cases, consistent with Bollinger's point that a close outside the band is not on its own a reversal.
ATR shows how bitcoin has calmed. Its yearly median ATR fell from 23.8% of price in 2010, when prices were thin and early, to 2.2% in 2016, its lowest year, and stood at 2.9% in 2026 to Oct. 22. Ether's was 7.5% in 2016, reached its lowest, 3.2%, in 2023, and stood at 3.9% in 2026 to Oct. 22.
Fig. 2. Average true range as a share of price, bitcoin from 2014 and ether from 2016.
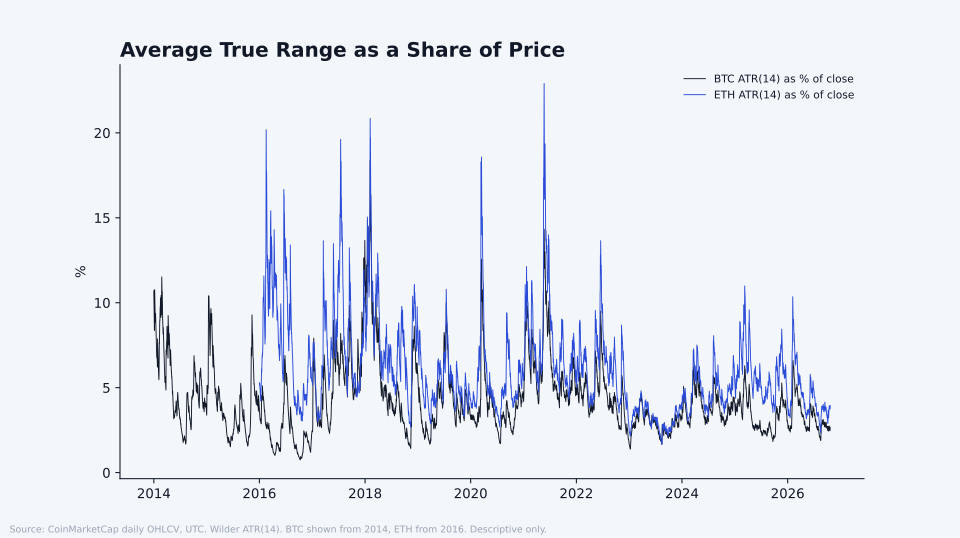
Fig. 2. Average true range as a share of price. Prices and market data: CoinMarketCap, https://coinmarketcap.com, accessed Oct. 22, 2026, 12:24 a.m. ET. Le Coin calculation.
6. The objection
The samples are small, with 20 to 67 cases per group, and nearly all one-year windows overlap (62 of 63 for bitcoin's upper-band closes), so the cases are not independent and bitcoin's long-run rise lifts every one-year figure. A squeeze is measured against each coin's own past year, so a squeeze in a calm year is narrower in dollar terms than one in a wild year. Bollinger also warns against statistical assumptions: security prices are not normally distributed, he writes, and he finds about 90% of prices inside the default bands, not 95% (source 1).
7. The tell
In Le Coin's view, both tools are best read as rulers. They say how much a price has been moving, and the squeeze record says little about which way it moves next.
Sources
- 1John Bollinger, "Bollinger Band Rules," BollingerBands.com, https://www.bollingerbands.com/bollinger-band-rules, accessed Oct. 23, 2026, 4:15 p.m. ET.
- 2TradingView support, "Bollinger Bands (BB)," https://www.tradingview.com/support/solutions/43000501840-bollinger-bands-bb/, accessed Oct. 23, 2026, 4:21 p.m. ET.
- 3TradingView support, "Average True Range (ATR)," https://www.tradingview.com/support/solutions/43000501823-average-true-range-atr/, accessed Oct. 23, 2026, 4:21 p.m. ET.
- 4Prices and market data: CoinMarketCap, https://coinmarketcap.com, accessed Oct. 22, 2026, 12:24 a.m. ET; Le Coin Digital Assets Expert calculation from CoinMarketCap Pro API daily OHLCV (v2 ohlcv/historical) for BTC (July 14, 2010 to Oct. 22, 2026) and ETH (Aug. 8, 2015 to Oct. 22, 2026), files last refreshed Oct. 23, 2026, 6:16 a.m. ET. Bollinger Bands (20, 2) and ATR(14) with Wilder smoothing on daily data; squeeze = bandwidth at or below the 5th percentile of the prior 365 days; forward changes over 30, 90 and 365 calendar days; 30-day whipsaw rule; full tables in the research pack.Holding the Corner.
Not financial advice.