1. How to read it / Where it misleads
Two indicators often sit under a crypto chart to answer different questions. MACD, short for moving average convergence divergence, asks which way momentum is pointing. ADX, the average directional index, asks how strong a trend is, whichever way it runs. This entry explains what each measures, how they are commonly paired, and what bitcoin and ether history shows.
This explains how indicators are calculated and described. It is not a signal, forecast or recommendation, and past behaviour does not predict prices.
2. Where they come from
TradingView credits MACD to Gerald Appel in the 1970s, with Thomas Aspray adding the histogram in 1986 (source 1). TradingView says J. Welles Wilder Jr. designed ADX for daily commodity charts (source 2). He featured average true range, which ADX uses, in his book New Concepts in Technical Trading Systems, published in 1978 (source 3).
3. What they measure
The MACD line is the gap between a 12-day and a 26-day exponential moving average of closes; an exponential average weights recent prices more heavily. The signal line is a 9-day exponential average of the MACD line, and the histogram is the gap between the two (source 1). When MACD is above zero, the shorter average sits above the longer one. Because MACD is measured in dollars, its size grows with the price, so only its sign and its crosses compare across years.
ADX comes from two directional lines. +DI tracks how much each day's high exceeds the prior day's, and -DI how much each low undercuts the prior low, both scaled by average true range, a measure of the typical daily price range. ADX smooths the gap between them, relative to their sum, over 14 days (source 2). It rises in strong trends up or down and does not say which.
4. How they are used
TradingView describes the signal-line cross and the zero-line cross as the most common MACD readings (source 1). For ADX, it reports Wilder's view that a reading above 25 marks a strong trend and one below 20 a weak or absent trend, and notes that false signals are most common when ADX is below 25 (source 2). In common usage, the two are paired so that ADX describes trend strength alongside MACD's direction.
Fig. 1. Bitcoin's price with MACD zero-line crosses marked, the MACD panel and the ADX panel, over the last two years.
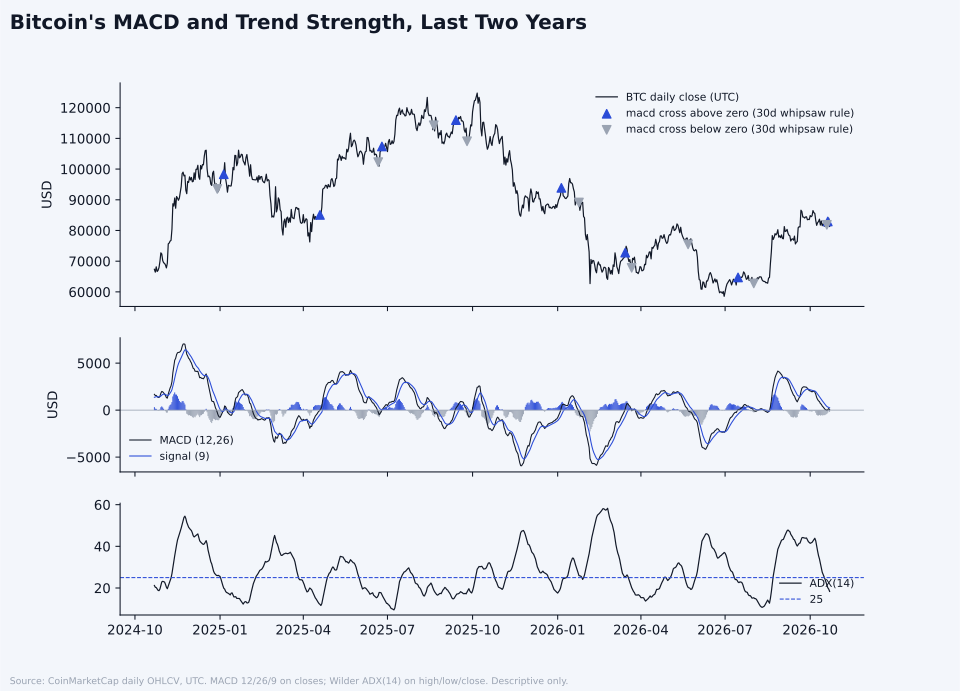
Fig. 1. Bitcoin's MACD and trend strength, last two years. Prices and market data: CoinMarketCap, https://coinmarketcap.com, accessed Oct. 22, 2026, 12:24 a.m. ET. Le Coin calculation.
5. What the history shows
Le Coin's Digital Assets Expert counted events on UTC daily closes for bitcoin from 2010 and ether from 2016, ignoring any event that repeated the same type within 30 days, a 30-day whipsaw rule (source 4).
Signal-line crosses up and down came out about the same. Thirty days after bitcoin's MACD crossed above its signal line, the price was higher in 52 of 89 cases, with a median of 3.4%. After it crossed below, the price was higher in 49 of 83, median 3.5%. Ether had 51 crosses above and 48 below.
Zero-line crosses were rarer: 62 above and 65 below for bitcoin, 43 and 44 for ether. A year after either kind, bitcoin was usually higher: 44 of 58 after crosses above zero and 43 of 60 after crosses below.
ADX spent more time above 25 than below it: 57.9% of days for bitcoin and 61.8% for ether. Bitcoin's ADX crossed above 25 with +DI leading 45 times and with -DI leading 34 times. Which line leads reflects the direction the price was already moving, so these groups sort past events by prior direction rather than test one reading against another. Thirty days later the price was higher in 33 of 45 and 16 of 34 of those cases.
Fig. 2. Past forward returns after MACD zero-line crosses, bitcoin and ether.
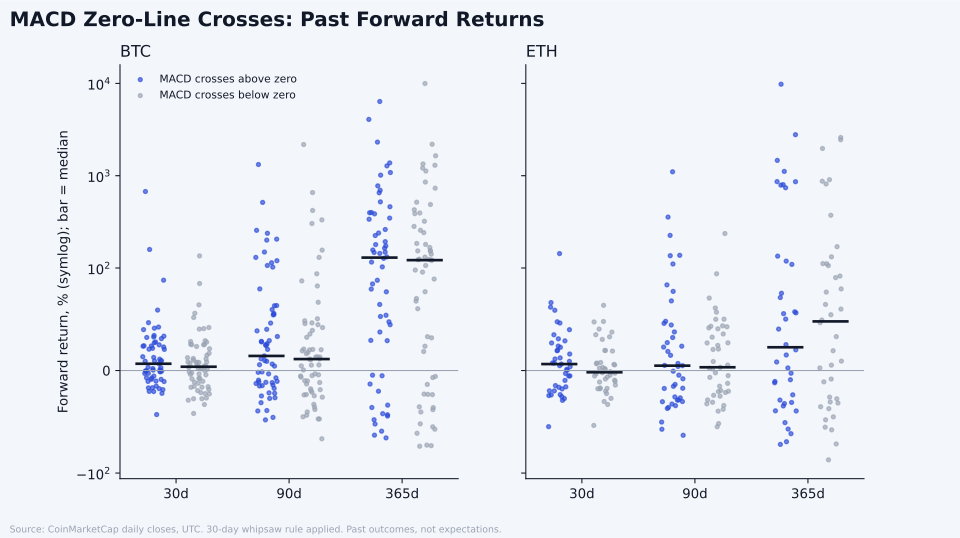
Fig. 2. MACD zero-line crosses: past forward returns. Prices and market data: CoinMarketCap, https://coinmarketcap.com, accessed Oct. 22, 2026, 12:24 a.m. ET. Le Coin calculation.
6. The objection
Groups hold 21 to 89 cases; in the smallest, ether's 23 ADX crosses with -DI leading, one case moves the share by about 4 points. Nearly all one-year windows overlap, so the cases are not independent and the long-run rise in both coins lifts every one-year figure. MACD and ADX also draw on the same prices, so pairing them is less independent than it looks.
7. The tell
In Le Coin's view, MACD is best read as a description of where two averages sit relative to each other, and ADX as a description of how one-sided recent trading has been. Neither says what comes next.
Sources
- 1TradingView support, "Moving average convergence divergence (MACD) indicator," https://www.tradingview.com/support/solutions/43000502344-macd-moving-average-convergence-divergence/, accessed Oct. 23, 2026, 4:21 p.m. ET.
- 2TradingView support, "Average Directional Index (ADX)," https://www.tradingview.com/support/solutions/43000589099-average-directional-index-adx/, accessed Oct. 23, 2026, 4:21 p.m. ET.
- 3TradingView support, "Average True Range (ATR)," https://www.tradingview.com/support/solutions/43000501823-average-true-range-atr/, accessed Oct. 23, 2026, 4:21 p.m. ET.
- 4Prices and market data: CoinMarketCap, https://coinmarketcap.com, accessed Oct. 22, 2026, 12:24 a.m. ET; Le Coin Digital Assets Expert calculation from CoinMarketCap Pro API daily OHLCV (v2 ohlcv/historical) for BTC (July 14, 2010 to Oct. 22, 2026) and ETH (Aug. 8, 2015 to Oct. 22, 2026), files last refreshed Oct. 23, 2026, 6:16 a.m. ET. MACD (12, 26, 9) on daily closes; ADX(14) with Wilder smoothing on daily highs and lows; forward changes over 30, 90 and 365 calendar days; 30-day whipsaw rule; full tables in the research pack.Holding the Corner.
Not financial advice.