1. How to read it / Where it misleads
Ichimoku is a Japanese charting system that summarizes where recent trading ranges sit, and a chart with it switched on looks crowded: two thin lines weaving around the price, a shaded band pushed ahead of it, and a fifth line trailing behind. TradeStation describes it as a price-channel indicator used to gauge trend direction along with support and resistance levels, the zones where price has previously stalled (source 2). This entry explains what each part measures, how the cloud, the Kijun-sen and the TK cross are described in platform guides, and what bitcoin and ether history shows after past occurrences.
This explains how an indicator is calculated and described. It is not a signal, forecast or recommendation, and past behaviour does not predict prices.
2. Where it comes from
TradingView credits the Ichimoku Cloud to Goichi Hosoda, who introduced it in the late 1960s (source 1; TradingView spells the name "Hosada"). The full name, Ichimoku Kinko Hyo, translates, in TradeStation's wording, as "one glance balanced chart" (source 2). TradeStation notes the method was originally designed for weekly charts, and lists shorter alternative inputs for daily charts (source 2).
3. How it is built
The Tenkan-sen, Kijun-sen and Senkou Span B are midpoints: the highest high plus the lowest low over a window, divided by two, and Senkou Span A averages the first two (source 2). That makes the cloud a measure of where the recent trading range sits, rather than an average of closes.
- Tenkan-sen, the conversion line, is the midpoint of the last 9 days.
- Kijun-sen, the base line, is the midpoint of the last 26 days.
- Senkou Span A is the average of those two lines, plotted 26 days ahead.
- Senkou Span B is the midpoint of the last 52 days, also plotted 26 days ahead.
- The cloud, or kumo, is the area between the two spans. Chikou Span, the close plotted 26 days back, is not used in this entry.
The 9, 26 and 52 settings are conventions, and TradeStation lists alternative daily inputs (source 2).
4. How it is described
TradingView describes price above the cloud as indicating an uptrend, price below it as a downward trend, and price inside it as transitioning (source 1). TradeStation writes that traders typically treat Tenkan above Kijun as bullish, meaning pointing to rising prices, and the reverse as bearish, and read a move through the cloud as a possible change in trend (source 2). The day the two lines cross is called a TK cross, short for Tenkan-Kijun. This entry groups each cross by where the price sat relative to the cloud that day. The Kijun-sen marks the middle of roughly the past month's range.
Fig. 1. Bitcoin on a log-scale price chart, where equal distances show equal percentage moves, with the cloud shaded and closes crossing above (n = 56) and below (n = 58) the cloud marked, after a 30-day whipsaw rule, which ignores a repeat of the same event within 30 days.
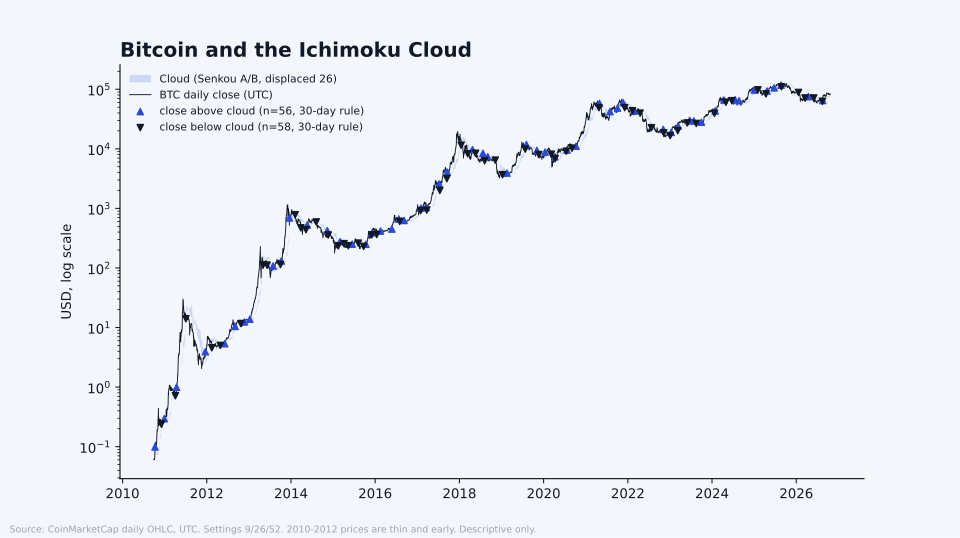
Fig. 1. Bitcoin and the Ichimoku Cloud. Prices and market data: CoinMarketCap, https://coinmarketcap.com, accessed Oct. 22, 2026, 12:24 a.m. ET. Le Coin calculation.
5. What the history shows
Le Coin's Digital Assets Expert counted events on UTC daily closes for bitcoin from late 2010 and ether from 2016, ignoring any event that repeated the same type within 30 days (source 3). That leaves 197 bitcoin TK crosses and 137 for ether. Bitcoin closed back above the cloud 56 times and below it 58 times; ether did so 42 and 34 times.
After bitcoin's closes above the cloud, the price 30 days later was higher in 37 of 56 cases. After bullish TK crosses above the cloud, it was higher in 19 of 33 cases with a full 30-day window (34 crosses in all).
The one-year figures need a warning before any of them. Nearly every 365-day window overlaps the one before it: 53 of 54 for bitcoin's closes above the cloud. The cases are not independent, and the medians mostly reflect bitcoin's and ether's long-run rise over the sample. Bearish groups show it clearly. A year after bitcoin's bearish TK crosses above the cloud, the price was higher in 31 of 45 cases, with a median gain of 109.4%.
Fig. 2. Past forward returns after Tenkan-Kijun crosses, grouped by cloud position, for bitcoin and ether. Each cell holds 10 to 47 cases.
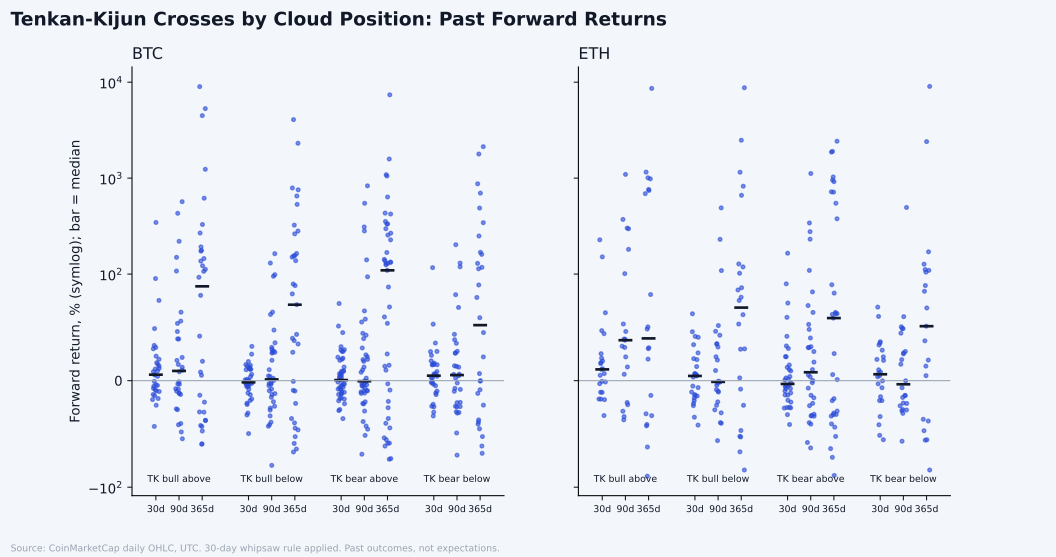
Fig. 2. Tenkan-Kijun crosses by cloud position: past forward returns. Prices and market data: CoinMarketCap, https://coinmarketcap.com, accessed Oct. 22, 2026, 12:24 a.m. ET. Le Coin calculation.
6. The objection
Each group is small. With 10 to 58 cases per cell, one case moves the share of positive outcomes by 2 to 10 points. The extremes come from bitcoin's thin early years and ether's 2016 and 2017 run. And the cloud uses only highs and lows, so it can double-count what a moving average or RSI on the same chart already shows.
7. The tell
In Le Coin's view, the cloud is best read as a map of where the past few months of trading sat. It shows the range price has left behind, not where it goes next.
Sources
- 1TradingView support, "Ichimoku Cloud," https://www.tradingview.com/support/solutions/43000589152-ichimoku-cloud/, accessed Oct. 23, 2026, 4:17 p.m. ET.
- 2TradeStation Help, "Ichimoku Cloud (Indicator)," https://help.tradestation.com/10_00/eng/tradestationhelp/elanalysis/indicator/ichimoku_cloud_indicator_.htm, accessed Oct. 23, 2026, 4:17 p.m. ET.
- 3Prices and market data: CoinMarketCap, https://coinmarketcap.com, accessed Oct. 22, 2026, 12:24 a.m. ET; Le Coin Digital Assets Expert calculation from CoinMarketCap Pro API daily OHLCV (v2 ohlcv/historical) for BTC (July 14, 2010 to Oct. 22, 2026) and ETH (Aug. 8, 2015 to Oct. 22, 2026), files last refreshed Oct. 23, 2026, 6:16 a.m. ET. Settings 9/26/52 on daily highs and lows; forward changes over 30, 90 and 365 calendar days; 30-day whipsaw rule; full tables in the research pack.Holding the Corner.
Not financial advice.